Energy Efficiency Trends In Commercial Buildings
(Excerpt from final report: “Energy Efficiency Trends In Residential & Commercial Buildings,” October 2008). The full report can be found here.
Throughout history, buildings have changed to address social needs. A dramatic example: the advent of the skyscraper a century ago, which exploited the new technology of steel framing to overcome the scarcity of real estate in teeming American cities. Suddenly real estate extended into a third dimension, enabling extraordinary growth in a contained footprint.
Today’s building industry appears to be entering another era of change, with a view toward minimizing a different kind of footprint: the energy, carbon, and environmental footprint of commercial and residential buildings. Once again, change is being driven by a need to optimize and conserve resources — this time, clean air, water, and energy as well as land. And, once again, transformative technologies may hold the key to meeting the challenges.
As designers, developers, and owners search for ways to minimize the operating costs and environmental impacts of buildings, while also increasing their functionality and appeal to occupants, “green” trends are becoming observable in the marketplace.
The services demanded of buildings — lighting, warmth in the winter, cooling in the summer, water heating, electronic entertainment, computing, refrigeration, and cooking — require significant energy use, about 40 quadrillion Btu (quads) per year. Energy consumption in buildings has been growing in aggregate over time.
Today, the nation’s 114 million households and more than 4.7 million commercial buildings consume more energy than the transportation or industry sectors, accounting for nearly 40 percent of total U.S. energy use.
The total utility bill for energy used by U.S. buildings topped $369 billion in 2005. This energy was driven by:
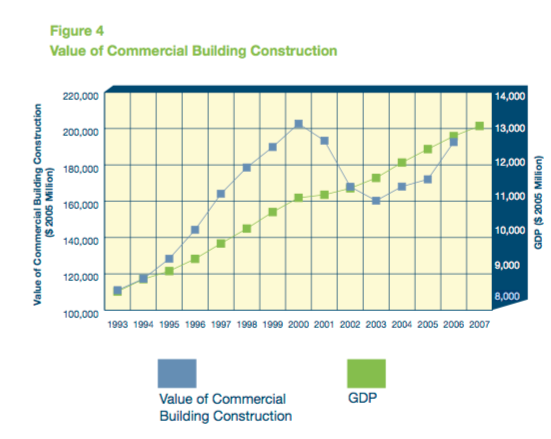
 Data on annual additions to commercial floor space are not publicly available. A proxy is the annual value of commercial building construction, which roughly tracks GDP growth. During the 1990s, the annual value of commercial building construction roughly doubled before falling precipitously during the recession in the early part of this decade. The drop in commercial construction was felt most strongly in office, lodging, and warehouse construction, sectors that had seen the strongest growth during the preceding decade. By 2006, the annual value of commercial building construction had largely recovered and was again approaching the peak seen in 2000, when it surpassed $200 billion (figure 4).
 The buildings industry — including new construction and renovation — accounts for over 9 percent of GDP
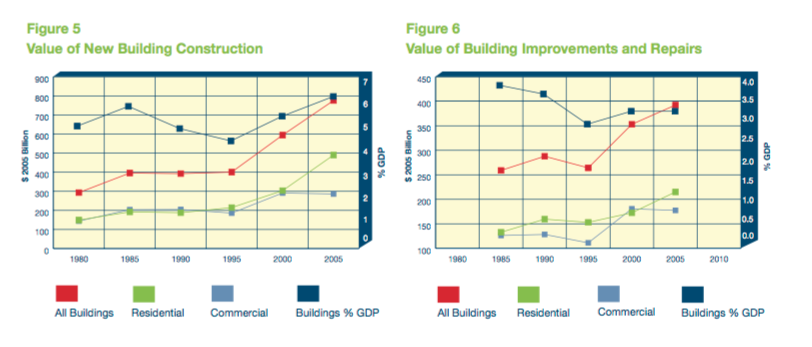
Construction of new residential and commercial building contributed over 6 percent of GDP, accounting for over $775 billion of a $12.5 trillion economy in 2005. While the relative contributions of residential and commercial construction were about even during most of the last two decades, residential construction has been a strong engine of economic growth, nearly doubling its share of GDP from 2000 to 2005.
The value of residential and commercial repairs and retrofits reached nearly $400 billion in 2005. These improvements ranged from home remodeling or roofing to commercial lighting retrofits or complete building tear-outs. This activity, combined with the value of new construction, brought the buildings industry’s contribution to GDP to 9 percent in 2005.
Energy Mix and Impacts on Carbon Dioxide Emissions
Overall growth (in the building industry), despite the recent down- turn, has driven an increase in electricity consumption. Electricity is the largest energy source for buildings, and that predominance has grown. Natural gas is the second largest energy source and petroleum (predominantly heating oil) a distant third. Buildings demand for electricity was the principal force behind the 58 percent growth in net electricity generation from 1985 to 2006.
Over 70 percent of U.S. electricity is generated by burning coal, petroleum, or natural gas; another 20 percent is generated by nuclear power stations; and less than 9 percent comes from renewable sources, with 7 percent of that from hydroelectric dams. Conversions from one fuel form to another entail losses, as does the transportation and distribution of electricity over power lines. These losses are roughly twice the size of actual purchases, making electricity the largest buildings energy source in “primary” terms (including conversion and transportation losses) at about 72 percent in 2005.
The burning of coal and natural gas to supply buildings with electricity, coupled with direct burning of natural gas, makes buildings responsible for the largest share of U.S. carbon dioxide emissions. With the increase in buildings electricity consumption, that proportion has risen from about one-third of the total in 1980 to almost 40 percent in 2005 (Figure 5 & 6).
The buildings industry — including new construction and renovation — accounts for over 9 percent of GDP
Construction of new residential and commercial building contributed over 6 percent of GDP, accounting for over $775 billion of a $12.5 trillion economy in 2005. While the relative contributions of residential and commercial construction were about even during most of the last two decades, residential construction has been a strong engine of economic growth, nearly doubling its share of GDP from 2000 to 2005.
The value of residential and commercial repairs and retrofits reached nearly $400 billion in 2005. These improvements ranged from home remodeling or roofing to commercial lighting retrofits or complete building tear-outs. This activity, combined with the value of new construction, brought the buildings industry’s contribution to GDP to 9 percent in 2005.
Energy Mix and Impacts on Carbon Dioxide Emissions
Overall growth (in the building industry), despite the recent down- turn, has driven an increase in electricity consumption. Electricity is the largest energy source for buildings, and that predominance has grown. Natural gas is the second largest energy source and petroleum (predominantly heating oil) a distant third. Buildings demand for electricity was the principal force behind the 58 percent growth in net electricity generation from 1985 to 2006.
Over 70 percent of U.S. electricity is generated by burning coal, petroleum, or natural gas; another 20 percent is generated by nuclear power stations; and less than 9 percent comes from renewable sources, with 7 percent of that from hydroelectric dams. Conversions from one fuel form to another entail losses, as does the transportation and distribution of electricity over power lines. These losses are roughly twice the size of actual purchases, making electricity the largest buildings energy source in “primary” terms (including conversion and transportation losses) at about 72 percent in 2005.
The burning of coal and natural gas to supply buildings with electricity, coupled with direct burning of natural gas, makes buildings responsible for the largest share of U.S. carbon dioxide emissions. With the increase in buildings electricity consumption, that proportion has risen from about one-third of the total in 1980 to almost 40 percent in 2005 (Figure 5 & 6).
 Buildings account for 40 percent of all energy use in the United States. This sector consumes more energy than either industrial or transportation, surpassing industrial as the number one consuming sector in 1998. Both residential and commercial building energy use are growing, and represent an ever-increasing share of U.S. energy consumption. While residential energy consumption exceeds commercial, the latter has been increasing more rapidly, rising from just 14 percent of total U.S. energy consumption in 1980 to 18 percent by 2005, a 70 percent increase (figure 8).
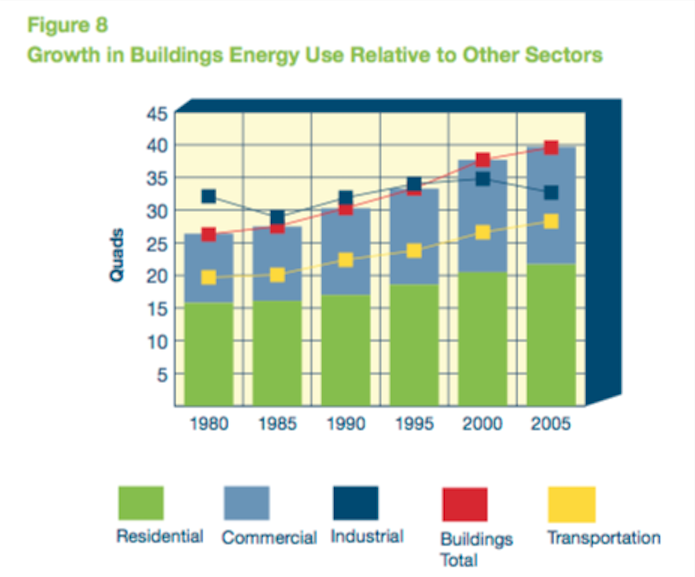 The growth in buildings energy consumption comes predominantly from electricity. Electricity’s share of primary energy use in buildings increased from 56 percent in 1980 to 72 percent in 2005. The most versatile fuel form, electricity also is the most expensive per equivalent Btu. Electricity usage accounted for 65 percent of building energy costs in 2005. However, electricity prices declined in real terms during this period and, as a result, expenditures for electricity did not rise as quickly as overall usage. Still, electricity expenditures rose with increased demand from $144 billion in 1980 to $238 billion in 2005 as measured in constant 2005 dollars.
Use of natural gas, the second largest energy source in the buildings sector, was essentially flat from 1980 to 2005 and decreased as a percentage of total use from 28 percent in 1980 to just 20 percent by 2005. Still, expenditures rose significantly due to an increase of more than 60 percent in the price of natural gas, which was driven largely by increased utility demand for gas to be used for electricity production.
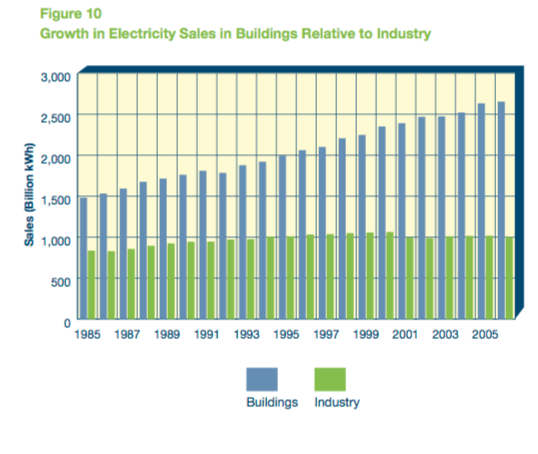
From 1985 to 2006, retail sales of electricity to residential and commercial buildings increased by 1,180 billion kWh, an increase of nearly 80 percent. Over the same period, industrial sector demand for electricity increased by 165 billion kWh, or 20 percent. Stated differently, of the total increase in retail electricity sales reported by the EIA from 1985 to 2006, 87 percent was attributable to buildings sector demand. This large increase in turn drove the need for more power plants, and for more coal, uranium, and natural gas to generate electricity. Coal- red plants accounted for 39 percent of the increase, natural gas- red plants for 31 percent, and nuclear plants for 28 percent. (In the case of nuclear power, much of the increase in net generation was due to increased plant capacity factor, which rose from 58 percent in 1985 to 90 percent in 2006.) (Figure 10)
The growth in buildings energy consumption comes predominantly from electricity. Electricity’s share of primary energy use in buildings increased from 56 percent in 1980 to 72 percent in 2005. The most versatile fuel form, electricity also is the most expensive per equivalent Btu. Electricity usage accounted for 65 percent of building energy costs in 2005. However, electricity prices declined in real terms during this period and, as a result, expenditures for electricity did not rise as quickly as overall usage. Still, electricity expenditures rose with increased demand from $144 billion in 1980 to $238 billion in 2005 as measured in constant 2005 dollars.
Use of natural gas, the second largest energy source in the buildings sector, was essentially flat from 1980 to 2005 and decreased as a percentage of total use from 28 percent in 1980 to just 20 percent by 2005. Still, expenditures rose significantly due to an increase of more than 60 percent in the price of natural gas, which was driven largely by increased utility demand for gas to be used for electricity production.
From 1985 to 2006, retail sales of electricity to residential and commercial buildings increased by 1,180 billion kWh, an increase of nearly 80 percent. Over the same period, industrial sector demand for electricity increased by 165 billion kWh, or 20 percent. Stated differently, of the total increase in retail electricity sales reported by the EIA from 1985 to 2006, 87 percent was attributable to buildings sector demand. This large increase in turn drove the need for more power plants, and for more coal, uranium, and natural gas to generate electricity. Coal- red plants accounted for 39 percent of the increase, natural gas- red plants for 31 percent, and nuclear plants for 28 percent. (In the case of nuclear power, much of the increase in net generation was due to increased plant capacity factor, which rose from 58 percent in 1985 to 90 percent in 2006.) (Figure 10)
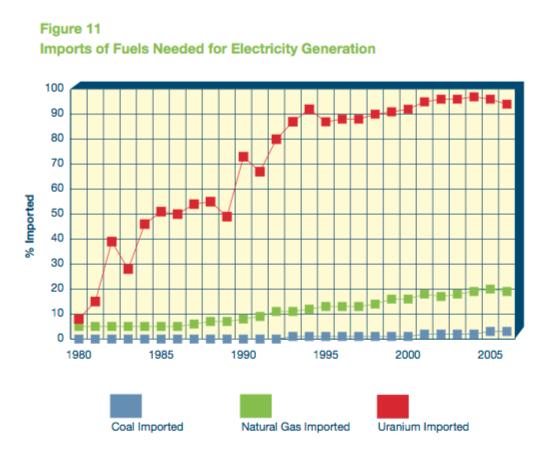
 Natural gas, which has accounted for a growing share of new power generation capacity, is an increasingly imported commodity. Imports grew from 5 percent of U.S. total use in 1985 to nearly 20 percent in 2005. The United States imports the most natural gas from Canada: 85 percent of total imports in 2006.
A large portion of uranium for nuclear fission is imported. Owners and operators of U.S. civilian nuclear power reactors purchased a total of 67 million pounds of uranium oxide equivalent from U.S. and foreign suppliers during 2006. Approximately 16 percent of all uranium purchased was U.S.-origin; foreign-origin uranium accounted for 56 million pounds (84 percent) of the deliveries. In 2006, the three most important nations from which the U.S. imported uranium were Australia (30 percent), Russia (27 percent), and Canada (24 percent). Although less important, other sources of uranium include Namibia, Uzbekistan, Kazakhstan, and South Africa. (Figure 11)
Natural gas, which has accounted for a growing share of new power generation capacity, is an increasingly imported commodity. Imports grew from 5 percent of U.S. total use in 1985 to nearly 20 percent in 2005. The United States imports the most natural gas from Canada: 85 percent of total imports in 2006.
A large portion of uranium for nuclear fission is imported. Owners and operators of U.S. civilian nuclear power reactors purchased a total of 67 million pounds of uranium oxide equivalent from U.S. and foreign suppliers during 2006. Approximately 16 percent of all uranium purchased was U.S.-origin; foreign-origin uranium accounted for 56 million pounds (84 percent) of the deliveries. In 2006, the three most important nations from which the U.S. imported uranium were Australia (30 percent), Russia (27 percent), and Canada (24 percent). Although less important, other sources of uranium include Namibia, Uzbekistan, Kazakhstan, and South Africa. (Figure 11)
 U.S. buildings currently contribute 9 percent of the world’s carbon dioxide emissions
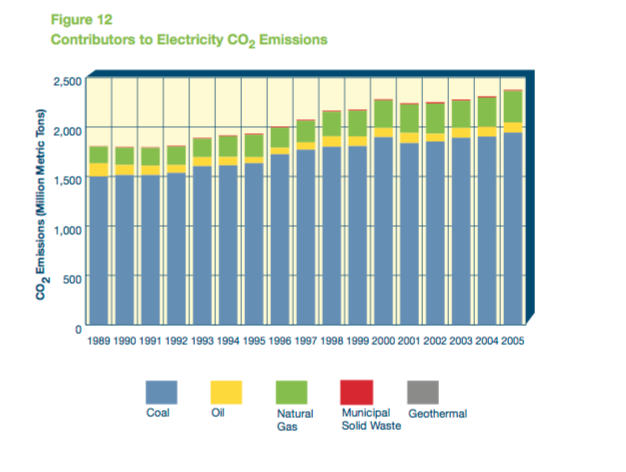
The growth in buildings energy consumption has resulted in carbon dioxide emissions rising from about a third of total U.S. emissions in 1980 to almost 40 percent by 2005. This is a function of the increase in buildings electricity use, 70 percent of which is dependent on fossil fuels. Despite recent efforts to use cleaner coal technologies, the majority of carbon dioxide emissions are still attributable to coal. Both geothermal and municipal solid waste represented negligible amounts of carbon dioxide emissions: 0.4 and 11 million metric tons in 2005, respectively (Figure 12).
U.S. buildings currently contribute 9 percent of the world’s carbon dioxide emissions
The growth in buildings energy consumption has resulted in carbon dioxide emissions rising from about a third of total U.S. emissions in 1980 to almost 40 percent by 2005. This is a function of the increase in buildings electricity use, 70 percent of which is dependent on fossil fuels. Despite recent efforts to use cleaner coal technologies, the majority of carbon dioxide emissions are still attributable to coal. Both geothermal and municipal solid waste represented negligible amounts of carbon dioxide emissions: 0.4 and 11 million metric tons in 2005, respectively (Figure 12).
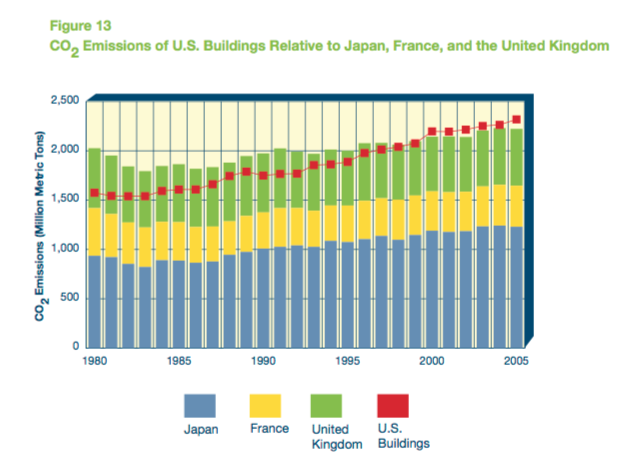
 From a global perspective, U.S. buildings represented about 9 percent of worldwide carbon dioxide emissions in 2005 (2,318 million metric tons of carbon dioxide). In fact, U.S. buildings would rank just behind the United States itself (5,957) and China (5,322) as the largest source of carbon dioxide emissions. Carbon dioxide emissions from U.S. buildings exceed the combined emissions of Japan, France, and the United Kingdom (Figure 13).
 Overall commercial energy use has grown, and only recently has some improvement in energy intensity been noted
How energy is used in a commercial building has a large effect on energy efficiency strategies. The most important energy end-use across the stock of commercial buildings is lighting, accounting for fully one-quarter of total primary energy use. Heating and cooling are next in importance, each at about one- seventh of the total. Equal in magnitude — although not well defined by the Energy Information Administration — is a catch-all category of “other uses” such as service station equipment, ATM machines, medical equipment, and telecommunications equipment. Water heating, ventilation, and non-PC office equipment are each around 6 percent of the total, followed by refrigeration, computer use, and cooking (Figure 29).
Overall commercial energy use has grown, and only recently has some improvement in energy intensity been noted
How energy is used in a commercial building has a large effect on energy efficiency strategies. The most important energy end-use across the stock of commercial buildings is lighting, accounting for fully one-quarter of total primary energy use. Heating and cooling are next in importance, each at about one- seventh of the total. Equal in magnitude — although not well defined by the Energy Information Administration — is a catch-all category of “other uses” such as service station equipment, ATM machines, medical equipment, and telecommunications equipment. Water heating, ventilation, and non-PC office equipment are each around 6 percent of the total, followed by refrigeration, computer use, and cooking (Figure 29).
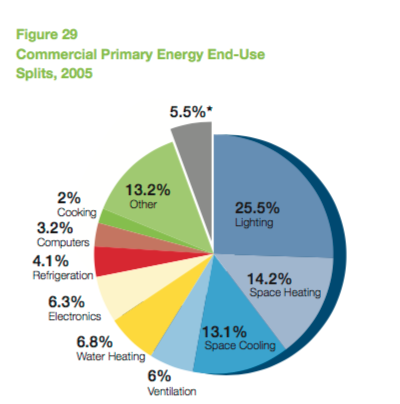 Figure 30 depicts index numbers for energy use based on total energy consumption, increases in floor space, weather effects, and energy intensity from 1985 to 2004. Estimated total floor space in commercial buildings grew slightly more than 35 percent over the period, with particularly rapid growth in the latter part of the 1990s.
Total primary energy consumption (i.e., including electricity losses) has increased every year since 1985, with the single exception of 2003. By 2004, total commercial energy consumption was nearly 50 percent higher than in 1985.
Commercial building sector energy intensity increased by 12 percent over the period. However, the trend shows a leveling off and slight decline since 2002.
Commercial buildings are sensitive to weather, although not to the same degree as residential buildings. The chart shows the estimated weather factor (as an index), based on heating and cooling degree-days by census region. The years 1990 and 1992 stand out: calendar year 1990 was characterized by a very warm winter weather and 1992 by an especially cool summer. The decreases in intensity observed in 1991 and since 2001 are primarily the result of weakness in the economy as a whole, resulting in increased vacancy rates of commercial office and retail space and falling utilization of occupied space.
Commercial energy codes are increasing energy efficiency
Energy use in commercial buildings is affected by the adoption of commercial energy codes, which originated in 1975 with the development of the American Society of Heating, Refrigerating and Air-Conditioning Engineers Standard 90-75 (“90” for ASHRAE Project Committee 90 and “75” for 1975, the year of publication). All energy codes and standards are historically linked to this original standard. Over the years, ASHRAE has added the Illuminating Engineering Society of North America (IESNA) as a co-sponsor to its standard, and also conducted the development of its standard under American National Standards Institute (ANSI) processes, adding these organizations to the title as well. In a parallel development, the requirements from ASHRAE standards have also been codified for adoption by states. This codification was first carried out in 1977 by the National Council of States on Building Codes and Standards (NCSBCS) in its Model Code for Energy Conservation (MCEC) (1977), then by the Council of American Building Officials (CABO) in its Model Energy Codes (MEC) (1983 to 1995), and currently by the International Code Council (ICC) in its International Energy Conservation Code (IECC) (1998 to present).
Since the passage of the Energy Policy Act of 1992, DOE has been responsible for tracking progress in ASHRAE Standard 90.1 and alerting states to the need for them to adopt new commercial energy codes that meet or exceed the provisions of any version of Standard 90.1 that DOE determines to save energy. Figure 31 shows the relative progress since the advent of U.S. commercial energy codes with ASHRAE Standard 90-75 in 1975 through ANSI/ASHRAE/IESNA Standard 90.1-2004. Through DOE’s latest determination for this standard, new commercial codes allow 25 percent less energy for code-regulated end-uses than the original commercial energy codes. DOE is focused on achieving an additional 30 percent improvement between Standard 90.1-2004 and Standard 90.1-2010.
In 1992, only five states and one U.S. territory had a commercial code that met the Energy Policy Act of 1992 requirements, which called for a code that met or exceeded the provisions of the ANSI/ASHRAE/IESNA Standard 90.1-1989. In 1992, there were other states with statewide codes, but the codes adopted in those states were older than Standard 90.1-1989.
By August 2008, all but ten states and one U.S. territory had statewide energy codes. Of the states without statewide codes (shown on the map in white), nine had county or local adoption of energy codes. In at least two of these states, a significant fraction of construction is covered by codes: Arizona and Hawaii. Not all of the codes adopted in 2008 met the standards DOE has set in the determination process set out in the Energy Policy Act of 1992. Thirty-seven states and one U.S. territory (shown in yellow, light green, and dark green) meet DOE’s latest published determination. Twenty-seven of these states (shown in dark green) will meet DOE’s upcoming publication of a determination for ASHRAE Standard 90.1-2004. States and territories marked in red have retained or adopted Standard 90.1-1989, which no longer meets the standards set by DOE in the determination process. States and territories marked in grey have codes older than Standard 90.1-1989.
This map also shows the nominal equivalence of versions of ASHRAE Standard 90.1 and the MEC or IECC. Some version of ASHRAE Standard 90.1 is used as a reference standard in each version of the MEC or IECC, and that reference standard was used to develop the equivalence shown in the map key.
Commercial building labeling and certification programs are small but growing
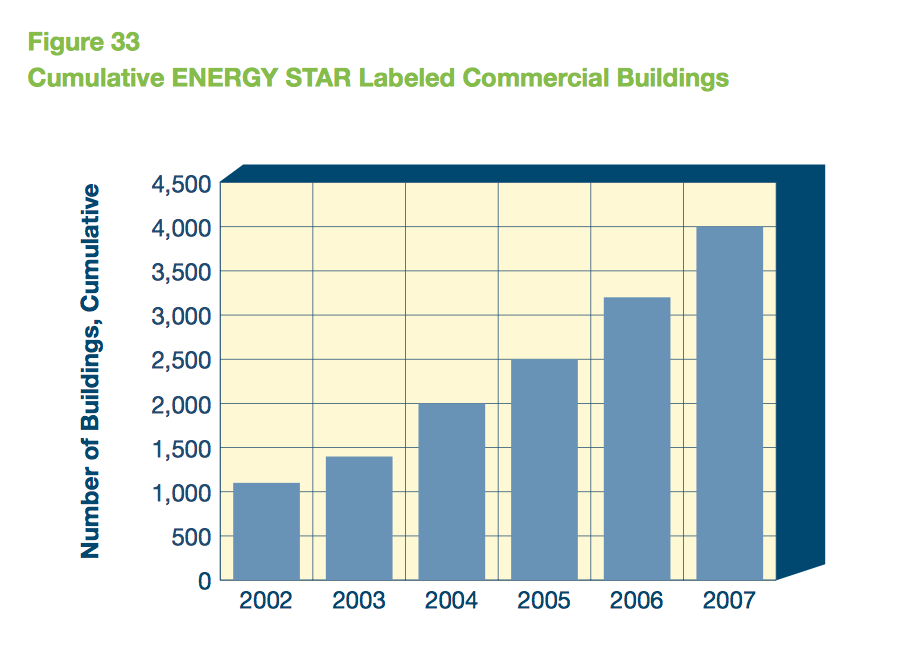
In addition to mandatory codes, voluntary programs such as ENERGY STAR reduce commercial building energy consumption, although such programs do not have large market penetration. According to the EPA, commercial buildings that have earned the ENERGY STAR label use on average 35 percent less energy than typical similar buildings. Currently, commercial buildings that can earn the label include offices, bank branches, financial centers, retailers, courthouses, hospitals, hotels, K–12 schools, medical offices, supermarkets, dormitories, and warehouses. ENERGY STAR buildings are statistically compared to similar buildings from a national survey conducted by the DOE’s Energy Information Administration. From 2004 to 2007, the cumulative number of ENERGY STAR-labeled buildings doubled from 2,000 to 4,000, representing over 740 million square feet, or roughly 1 percent of the total commercial sector (Figure 33).
Figure 30 depicts index numbers for energy use based on total energy consumption, increases in floor space, weather effects, and energy intensity from 1985 to 2004. Estimated total floor space in commercial buildings grew slightly more than 35 percent over the period, with particularly rapid growth in the latter part of the 1990s.
Total primary energy consumption (i.e., including electricity losses) has increased every year since 1985, with the single exception of 2003. By 2004, total commercial energy consumption was nearly 50 percent higher than in 1985.
Commercial building sector energy intensity increased by 12 percent over the period. However, the trend shows a leveling off and slight decline since 2002.
Commercial buildings are sensitive to weather, although not to the same degree as residential buildings. The chart shows the estimated weather factor (as an index), based on heating and cooling degree-days by census region. The years 1990 and 1992 stand out: calendar year 1990 was characterized by a very warm winter weather and 1992 by an especially cool summer. The decreases in intensity observed in 1991 and since 2001 are primarily the result of weakness in the economy as a whole, resulting in increased vacancy rates of commercial office and retail space and falling utilization of occupied space.
Commercial energy codes are increasing energy efficiency
Energy use in commercial buildings is affected by the adoption of commercial energy codes, which originated in 1975 with the development of the American Society of Heating, Refrigerating and Air-Conditioning Engineers Standard 90-75 (“90” for ASHRAE Project Committee 90 and “75” for 1975, the year of publication). All energy codes and standards are historically linked to this original standard. Over the years, ASHRAE has added the Illuminating Engineering Society of North America (IESNA) as a co-sponsor to its standard, and also conducted the development of its standard under American National Standards Institute (ANSI) processes, adding these organizations to the title as well. In a parallel development, the requirements from ASHRAE standards have also been codified for adoption by states. This codification was first carried out in 1977 by the National Council of States on Building Codes and Standards (NCSBCS) in its Model Code for Energy Conservation (MCEC) (1977), then by the Council of American Building Officials (CABO) in its Model Energy Codes (MEC) (1983 to 1995), and currently by the International Code Council (ICC) in its International Energy Conservation Code (IECC) (1998 to present).
Since the passage of the Energy Policy Act of 1992, DOE has been responsible for tracking progress in ASHRAE Standard 90.1 and alerting states to the need for them to adopt new commercial energy codes that meet or exceed the provisions of any version of Standard 90.1 that DOE determines to save energy. Figure 31 shows the relative progress since the advent of U.S. commercial energy codes with ASHRAE Standard 90-75 in 1975 through ANSI/ASHRAE/IESNA Standard 90.1-2004. Through DOE’s latest determination for this standard, new commercial codes allow 25 percent less energy for code-regulated end-uses than the original commercial energy codes. DOE is focused on achieving an additional 30 percent improvement between Standard 90.1-2004 and Standard 90.1-2010.
In 1992, only five states and one U.S. territory had a commercial code that met the Energy Policy Act of 1992 requirements, which called for a code that met or exceeded the provisions of the ANSI/ASHRAE/IESNA Standard 90.1-1989. In 1992, there were other states with statewide codes, but the codes adopted in those states were older than Standard 90.1-1989.
By August 2008, all but ten states and one U.S. territory had statewide energy codes. Of the states without statewide codes (shown on the map in white), nine had county or local adoption of energy codes. In at least two of these states, a significant fraction of construction is covered by codes: Arizona and Hawaii. Not all of the codes adopted in 2008 met the standards DOE has set in the determination process set out in the Energy Policy Act of 1992. Thirty-seven states and one U.S. territory (shown in yellow, light green, and dark green) meet DOE’s latest published determination. Twenty-seven of these states (shown in dark green) will meet DOE’s upcoming publication of a determination for ASHRAE Standard 90.1-2004. States and territories marked in red have retained or adopted Standard 90.1-1989, which no longer meets the standards set by DOE in the determination process. States and territories marked in grey have codes older than Standard 90.1-1989.
This map also shows the nominal equivalence of versions of ASHRAE Standard 90.1 and the MEC or IECC. Some version of ASHRAE Standard 90.1 is used as a reference standard in each version of the MEC or IECC, and that reference standard was used to develop the equivalence shown in the map key.
Commercial building labeling and certification programs are small but growing
In addition to mandatory codes, voluntary programs such as ENERGY STAR reduce commercial building energy consumption, although such programs do not have large market penetration. According to the EPA, commercial buildings that have earned the ENERGY STAR label use on average 35 percent less energy than typical similar buildings. Currently, commercial buildings that can earn the label include offices, bank branches, financial centers, retailers, courthouses, hospitals, hotels, K–12 schools, medical offices, supermarkets, dormitories, and warehouses. ENERGY STAR buildings are statistically compared to similar buildings from a national survey conducted by the DOE’s Energy Information Administration. From 2004 to 2007, the cumulative number of ENERGY STAR-labeled buildings doubled from 2,000 to 4,000, representing over 740 million square feet, or roughly 1 percent of the total commercial sector (Figure 33).
 Through 2006, 550 buildings had gone through the Leadership in Energy and Environmental Design (LEED) rating process, developed by the U.S. Green Buildings Council. In 2006, nearly 250 buildings were rated, three times the 2004 figure. LEED differs from ENERGY STAR in its focus on green materials in addition to energy efficiency measures.
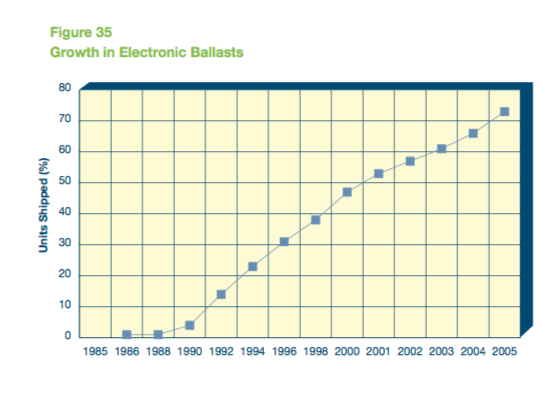
Within commercial buildings, lighting makes up a significant portion of energy consumption; therefore, energy-efficient lighting technologies have been targeted by efficiency programs. An example of an advanced, energy-saving technology that has achieved strong market acceptance is the electronic ballast. Traditionally, fluorescent lights (the dominant lighting type in commercial buildings) used magnetic ballasts, which operate lamps at the same frequency as the power line. With R&D support from the Department of Energy, higher frequency electronic ballasts were developed in the late 1970s and began to enter the market in 1985. Electronic ballasts can realize as much as a 30 percent increase in lighting energy efficiency relative to magnetic ballasts, and also enable dimming, remote control, and other energy-saving features. While sales of electronic ballasts were initially miniscule, by 2001 they had surpassed magnetic, and by 2005 constituted nearly three-quarters of the market. Electronic ballasts have saved an estimated $15 billion in commercial buildings energy use since 2005 (Figure 35).
Through 2006, 550 buildings had gone through the Leadership in Energy and Environmental Design (LEED) rating process, developed by the U.S. Green Buildings Council. In 2006, nearly 250 buildings were rated, three times the 2004 figure. LEED differs from ENERGY STAR in its focus on green materials in addition to energy efficiency measures.
Within commercial buildings, lighting makes up a significant portion of energy consumption; therefore, energy-efficient lighting technologies have been targeted by efficiency programs. An example of an advanced, energy-saving technology that has achieved strong market acceptance is the electronic ballast. Traditionally, fluorescent lights (the dominant lighting type in commercial buildings) used magnetic ballasts, which operate lamps at the same frequency as the power line. With R&D support from the Department of Energy, higher frequency electronic ballasts were developed in the late 1970s and began to enter the market in 1985. Electronic ballasts can realize as much as a 30 percent increase in lighting energy efficiency relative to magnetic ballasts, and also enable dimming, remote control, and other energy-saving features. While sales of electronic ballasts were initially miniscule, by 2001 they had surpassed magnetic, and by 2005 constituted nearly three-quarters of the market. Electronic ballasts have saved an estimated $15 billion in commercial buildings energy use since 2005 (Figure 35).
 Impacts of Policy and Regulation
By law, the Department of Energy must set energy efficiency standards for equipment and appliances at the maximum level of energy efficiency that is technically feasible and economically justified. DOE strives to establish standards that maximize consumer benefits and minimize negative impacts on manufacturers and other stakeholders.
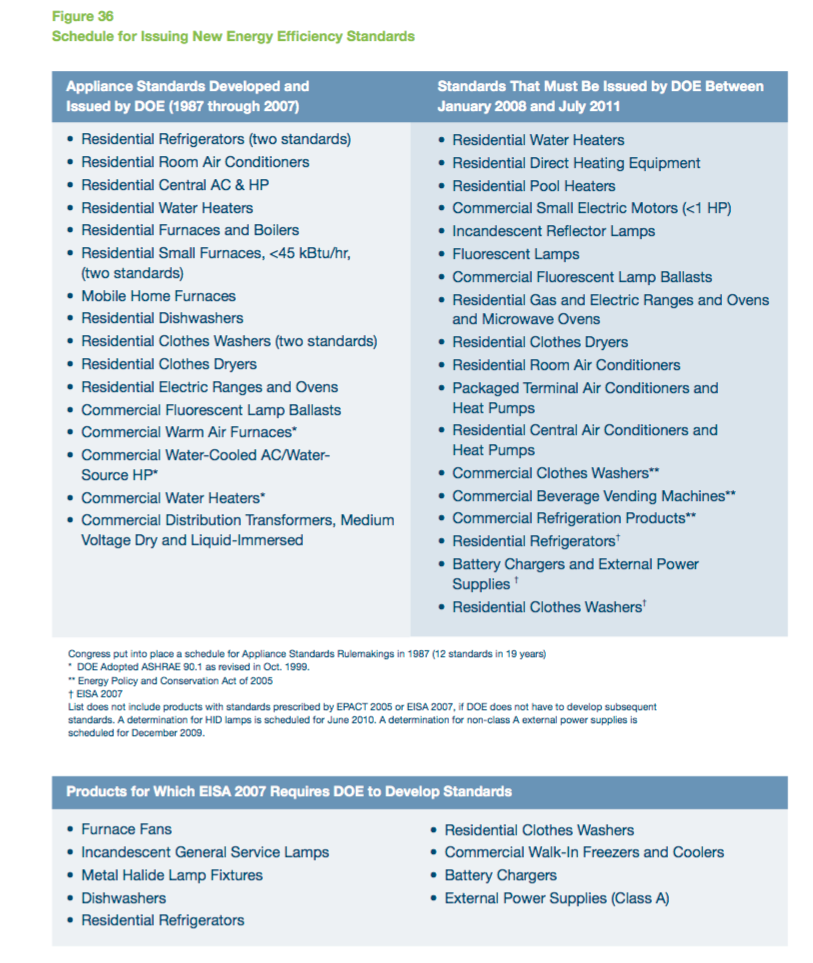
In 2006, the Department of Energy released a schedule for setting new appliance efficiency standards, outlining how DOE will address the appliance standards rulemaking backlog and meet the statutory requirements established in the Energy Policy and Conservation Act (EPCA) as modified by the Energy Policy Act (EPAct) 2005. With the recent passage of the Energy Independence and Security Act of 2007, Congress has increased the number of rulemakings DOE must issue beyond the obligations set forth in EPAct 2005, bringing the level of appliance standards activity to unprecedented levels. The schedule for issuing new standards is shown in Figure 36.
Impacts of Policy and Regulation
By law, the Department of Energy must set energy efficiency standards for equipment and appliances at the maximum level of energy efficiency that is technically feasible and economically justified. DOE strives to establish standards that maximize consumer benefits and minimize negative impacts on manufacturers and other stakeholders.
In 2006, the Department of Energy released a schedule for setting new appliance efficiency standards, outlining how DOE will address the appliance standards rulemaking backlog and meet the statutory requirements established in the Energy Policy and Conservation Act (EPCA) as modified by the Energy Policy Act (EPAct) 2005. With the recent passage of the Energy Independence and Security Act of 2007, Congress has increased the number of rulemakings DOE must issue beyond the obligations set forth in EPAct 2005, bringing the level of appliance standards activity to unprecedented levels. The schedule for issuing new standards is shown in Figure 36.
 State energy offices can also have a large impact on energy efficiency through standards, incentives, and efficiency programs. Utilities, working alone or with state energy offices, may also offer incentives for efficiency improvements. Utility-sponsored efficiency programs are often targeted at achieving peak load reductions.
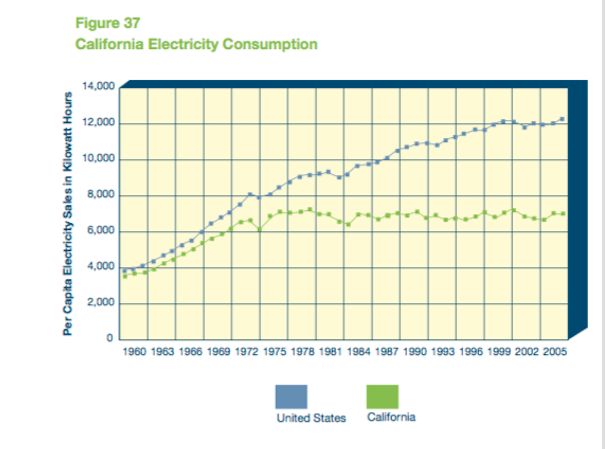
State energy policies promote building efficiency through appliance standards, regulations, tax incentives, education, and renewable energy portfolios. The State of California, through the California Energy Commission and later with the addition of the California Public Utilities Commission, has prioritized energy efficiency, demand side resources, renewable energy, and finally clean conventional energy sources. As a result of energy efficiency programs, appliance standards, and building codes, California electricity use remained level while U.S. consumption rose (Figure 37).
State energy offices can also have a large impact on energy efficiency through standards, incentives, and efficiency programs. Utilities, working alone or with state energy offices, may also offer incentives for efficiency improvements. Utility-sponsored efficiency programs are often targeted at achieving peak load reductions.
State energy policies promote building efficiency through appliance standards, regulations, tax incentives, education, and renewable energy portfolios. The State of California, through the California Energy Commission and later with the addition of the California Public Utilities Commission, has prioritized energy efficiency, demand side resources, renewable energy, and finally clean conventional energy sources. As a result of energy efficiency programs, appliance standards, and building codes, California electricity use remained level while U.S. consumption rose (Figure 37).
 Utilities play a role in energy efficiency through incentives, energy efficiency programs, and demand- side management programs. Utilities began demand- side management programs (DSM) to reduce the need for additional power-generating capacity. In 1993, spending reached its peak, dropping off after as a result of industry restructuring. Funding of DSM programs declined beginning in the mid-1990s when deregulation made it difficult for utilities to capture the benefits of their DSM investments. More recently, states have enacted a broad range of measures to provide incentives for utility investments in energy efficiency under both regulated and deregulated business models. DSM programs remain effective in states with regulated utilities. Other policies include public benefit funds for energy efficiency projects, energy efficiency resource standards, and non-traditional rate structures that enable utilities to reduce demand on their systems without eroding revenues.
Conclusion
The U.S. economy and environment are linked to the buildings we construct and the energy they use. Americans spend what amounts to a large percentage of GDP building, repairing, and powering the U.S. buildings stock. As the population and economy grow, so does our use of energy, which comes predominantly from fossil sources.
Increases in energy consumption are mitigated by:
Utilities play a role in energy efficiency through incentives, energy efficiency programs, and demand- side management programs. Utilities began demand- side management programs (DSM) to reduce the need for additional power-generating capacity. In 1993, spending reached its peak, dropping off after as a result of industry restructuring. Funding of DSM programs declined beginning in the mid-1990s when deregulation made it difficult for utilities to capture the benefits of their DSM investments. More recently, states have enacted a broad range of measures to provide incentives for utility investments in energy efficiency under both regulated and deregulated business models. DSM programs remain effective in states with regulated utilities. Other policies include public benefit funds for energy efficiency projects, energy efficiency resource standards, and non-traditional rate structures that enable utilities to reduce demand on their systems without eroding revenues.
Conclusion
The U.S. economy and environment are linked to the buildings we construct and the energy they use. Americans spend what amounts to a large percentage of GDP building, repairing, and powering the U.S. buildings stock. As the population and economy grow, so does our use of energy, which comes predominantly from fossil sources.
Increases in energy consumption are mitigated by:
- Population, which drives the number of homes, schools, and other community buildings
- Economic growth (real GDP), which is a major driver of new floor space in offices and retail buildings
- Building size (the amount of commercial floor space and the size of homes)
- Service demands (lighting and space conditioning, electronics, process loads)
- Real energy prices
- The efficiency with which energy service demands are met
A Growing Market
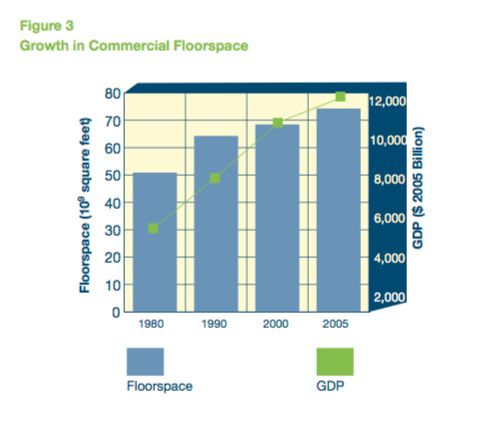
The amount of commercial floor space (in the U.S., has grown). Overall economic activity, as measured by GDP, is a key determinant of commercial sector growth, and, in turn, commercial floor space growth. From 1980 to 2005, GDP doubled in real terms from $5.8 trillion to $12.4 trillion as measured in constant year 2005 dollars. Consequently, though not perfectly correlated, the absolute amount of commercial floor- space (as measured in square feet) grew by roughly 50 percent over this same period (figure 3).
Data on annual additions to commercial floor space are not publicly available. A proxy is the annual value of commercial building construction, which roughly tracks GDP growth. During the 1990s, the annual value of commercial building construction roughly doubled before falling precipitously during the recession in the early part of this decade. The drop in commercial construction was felt most strongly in office, lodging, and warehouse construction, sectors that had seen the strongest growth during the preceding decade. By 2006, the annual value of commercial building construction had largely recovered and was again approaching the peak seen in 2000, when it surpassed $200 billion (figure 4).
The buildings industry — including new construction and renovation — accounts for over 9 percent of GDP
Construction of new residential and commercial building contributed over 6 percent of GDP, accounting for over $775 billion of a $12.5 trillion economy in 2005. While the relative contributions of residential and commercial construction were about even during most of the last two decades, residential construction has been a strong engine of economic growth, nearly doubling its share of GDP from 2000 to 2005.
The value of residential and commercial repairs and retrofits reached nearly $400 billion in 2005. These improvements ranged from home remodeling or roofing to commercial lighting retrofits or complete building tear-outs. This activity, combined with the value of new construction, brought the buildings industry’s contribution to GDP to 9 percent in 2005.
Energy Mix and Impacts on Carbon Dioxide Emissions
Overall growth (in the building industry), despite the recent down- turn, has driven an increase in electricity consumption. Electricity is the largest energy source for buildings, and that predominance has grown. Natural gas is the second largest energy source and petroleum (predominantly heating oil) a distant third. Buildings demand for electricity was the principal force behind the 58 percent growth in net electricity generation from 1985 to 2006.
Over 70 percent of U.S. electricity is generated by burning coal, petroleum, or natural gas; another 20 percent is generated by nuclear power stations; and less than 9 percent comes from renewable sources, with 7 percent of that from hydroelectric dams. Conversions from one fuel form to another entail losses, as does the transportation and distribution of electricity over power lines. These losses are roughly twice the size of actual purchases, making electricity the largest buildings energy source in “primary” terms (including conversion and transportation losses) at about 72 percent in 2005.
The burning of coal and natural gas to supply buildings with electricity, coupled with direct burning of natural gas, makes buildings responsible for the largest share of U.S. carbon dioxide emissions. With the increase in buildings electricity consumption, that proportion has risen from about one-third of the total in 1980 to almost 40 percent in 2005 (Figure 5 & 6).
Buildings account for 40 percent of all energy use in the United States. This sector consumes more energy than either industrial or transportation, surpassing industrial as the number one consuming sector in 1998. Both residential and commercial building energy use are growing, and represent an ever-increasing share of U.S. energy consumption. While residential energy consumption exceeds commercial, the latter has been increasing more rapidly, rising from just 14 percent of total U.S. energy consumption in 1980 to 18 percent by 2005, a 70 percent increase (figure 8).
The growth in buildings energy consumption comes predominantly from electricity. Electricity’s share of primary energy use in buildings increased from 56 percent in 1980 to 72 percent in 2005. The most versatile fuel form, electricity also is the most expensive per equivalent Btu. Electricity usage accounted for 65 percent of building energy costs in 2005. However, electricity prices declined in real terms during this period and, as a result, expenditures for electricity did not rise as quickly as overall usage. Still, electricity expenditures rose with increased demand from $144 billion in 1980 to $238 billion in 2005 as measured in constant 2005 dollars.
Use of natural gas, the second largest energy source in the buildings sector, was essentially flat from 1980 to 2005 and decreased as a percentage of total use from 28 percent in 1980 to just 20 percent by 2005. Still, expenditures rose significantly due to an increase of more than 60 percent in the price of natural gas, which was driven largely by increased utility demand for gas to be used for electricity production.
From 1985 to 2006, retail sales of electricity to residential and commercial buildings increased by 1,180 billion kWh, an increase of nearly 80 percent. Over the same period, industrial sector demand for electricity increased by 165 billion kWh, or 20 percent. Stated differently, of the total increase in retail electricity sales reported by the EIA from 1985 to 2006, 87 percent was attributable to buildings sector demand. This large increase in turn drove the need for more power plants, and for more coal, uranium, and natural gas to generate electricity. Coal- red plants accounted for 39 percent of the increase, natural gas- red plants for 31 percent, and nuclear plants for 28 percent. (In the case of nuclear power, much of the increase in net generation was due to increased plant capacity factor, which rose from 58 percent in 1985 to 90 percent in 2006.) (Figure 10)
Natural gas, which has accounted for a growing share of new power generation capacity, is an increasingly imported commodity. Imports grew from 5 percent of U.S. total use in 1985 to nearly 20 percent in 2005. The United States imports the most natural gas from Canada: 85 percent of total imports in 2006.
A large portion of uranium for nuclear fission is imported. Owners and operators of U.S. civilian nuclear power reactors purchased a total of 67 million pounds of uranium oxide equivalent from U.S. and foreign suppliers during 2006. Approximately 16 percent of all uranium purchased was U.S.-origin; foreign-origin uranium accounted for 56 million pounds (84 percent) of the deliveries. In 2006, the three most important nations from which the U.S. imported uranium were Australia (30 percent), Russia (27 percent), and Canada (24 percent). Although less important, other sources of uranium include Namibia, Uzbekistan, Kazakhstan, and South Africa. (Figure 11)
U.S. buildings currently contribute 9 percent of the world’s carbon dioxide emissions
The growth in buildings energy consumption has resulted in carbon dioxide emissions rising from about a third of total U.S. emissions in 1980 to almost 40 percent by 2005. This is a function of the increase in buildings electricity use, 70 percent of which is dependent on fossil fuels. Despite recent efforts to use cleaner coal technologies, the majority of carbon dioxide emissions are still attributable to coal. Both geothermal and municipal solid waste represented negligible amounts of carbon dioxide emissions: 0.4 and 11 million metric tons in 2005, respectively (Figure 12).
From a global perspective, U.S. buildings represented about 9 percent of worldwide carbon dioxide emissions in 2005 (2,318 million metric tons of carbon dioxide). In fact, U.S. buildings would rank just behind the United States itself (5,957) and China (5,322) as the largest source of carbon dioxide emissions. Carbon dioxide emissions from U.S. buildings exceed the combined emissions of Japan, France, and the United Kingdom (Figure 13).
Overall commercial energy use has grown, and only recently has some improvement in energy intensity been noted
How energy is used in a commercial building has a large effect on energy efficiency strategies. The most important energy end-use across the stock of commercial buildings is lighting, accounting for fully one-quarter of total primary energy use. Heating and cooling are next in importance, each at about one- seventh of the total. Equal in magnitude — although not well defined by the Energy Information Administration — is a catch-all category of “other uses” such as service station equipment, ATM machines, medical equipment, and telecommunications equipment. Water heating, ventilation, and non-PC office equipment are each around 6 percent of the total, followed by refrigeration, computer use, and cooking (Figure 29).
Figure 30 depicts index numbers for energy use based on total energy consumption, increases in floor space, weather effects, and energy intensity from 1985 to 2004. Estimated total floor space in commercial buildings grew slightly more than 35 percent over the period, with particularly rapid growth in the latter part of the 1990s.
Total primary energy consumption (i.e., including electricity losses) has increased every year since 1985, with the single exception of 2003. By 2004, total commercial energy consumption was nearly 50 percent higher than in 1985.
Commercial building sector energy intensity increased by 12 percent over the period. However, the trend shows a leveling off and slight decline since 2002.
Commercial buildings are sensitive to weather, although not to the same degree as residential buildings. The chart shows the estimated weather factor (as an index), based on heating and cooling degree-days by census region. The years 1990 and 1992 stand out: calendar year 1990 was characterized by a very warm winter weather and 1992 by an especially cool summer. The decreases in intensity observed in 1991 and since 2001 are primarily the result of weakness in the economy as a whole, resulting in increased vacancy rates of commercial office and retail space and falling utilization of occupied space.
Commercial energy codes are increasing energy efficiency
Energy use in commercial buildings is affected by the adoption of commercial energy codes, which originated in 1975 with the development of the American Society of Heating, Refrigerating and Air-Conditioning Engineers Standard 90-75 (“90” for ASHRAE Project Committee 90 and “75” for 1975, the year of publication). All energy codes and standards are historically linked to this original standard. Over the years, ASHRAE has added the Illuminating Engineering Society of North America (IESNA) as a co-sponsor to its standard, and also conducted the development of its standard under American National Standards Institute (ANSI) processes, adding these organizations to the title as well. In a parallel development, the requirements from ASHRAE standards have also been codified for adoption by states. This codification was first carried out in 1977 by the National Council of States on Building Codes and Standards (NCSBCS) in its Model Code for Energy Conservation (MCEC) (1977), then by the Council of American Building Officials (CABO) in its Model Energy Codes (MEC) (1983 to 1995), and currently by the International Code Council (ICC) in its International Energy Conservation Code (IECC) (1998 to present).
Since the passage of the Energy Policy Act of 1992, DOE has been responsible for tracking progress in ASHRAE Standard 90.1 and alerting states to the need for them to adopt new commercial energy codes that meet or exceed the provisions of any version of Standard 90.1 that DOE determines to save energy. Figure 31 shows the relative progress since the advent of U.S. commercial energy codes with ASHRAE Standard 90-75 in 1975 through ANSI/ASHRAE/IESNA Standard 90.1-2004. Through DOE’s latest determination for this standard, new commercial codes allow 25 percent less energy for code-regulated end-uses than the original commercial energy codes. DOE is focused on achieving an additional 30 percent improvement between Standard 90.1-2004 and Standard 90.1-2010.
In 1992, only five states and one U.S. territory had a commercial code that met the Energy Policy Act of 1992 requirements, which called for a code that met or exceeded the provisions of the ANSI/ASHRAE/IESNA Standard 90.1-1989. In 1992, there were other states with statewide codes, but the codes adopted in those states were older than Standard 90.1-1989.
By August 2008, all but ten states and one U.S. territory had statewide energy codes. Of the states without statewide codes (shown on the map in white), nine had county or local adoption of energy codes. In at least two of these states, a significant fraction of construction is covered by codes: Arizona and Hawaii. Not all of the codes adopted in 2008 met the standards DOE has set in the determination process set out in the Energy Policy Act of 1992. Thirty-seven states and one U.S. territory (shown in yellow, light green, and dark green) meet DOE’s latest published determination. Twenty-seven of these states (shown in dark green) will meet DOE’s upcoming publication of a determination for ASHRAE Standard 90.1-2004. States and territories marked in red have retained or adopted Standard 90.1-1989, which no longer meets the standards set by DOE in the determination process. States and territories marked in grey have codes older than Standard 90.1-1989.
This map also shows the nominal equivalence of versions of ASHRAE Standard 90.1 and the MEC or IECC. Some version of ASHRAE Standard 90.1 is used as a reference standard in each version of the MEC or IECC, and that reference standard was used to develop the equivalence shown in the map key.
Commercial building labeling and certification programs are small but growing
In addition to mandatory codes, voluntary programs such as ENERGY STAR reduce commercial building energy consumption, although such programs do not have large market penetration. According to the EPA, commercial buildings that have earned the ENERGY STAR label use on average 35 percent less energy than typical similar buildings. Currently, commercial buildings that can earn the label include offices, bank branches, financial centers, retailers, courthouses, hospitals, hotels, K–12 schools, medical offices, supermarkets, dormitories, and warehouses. ENERGY STAR buildings are statistically compared to similar buildings from a national survey conducted by the DOE’s Energy Information Administration. From 2004 to 2007, the cumulative number of ENERGY STAR-labeled buildings doubled from 2,000 to 4,000, representing over 740 million square feet, or roughly 1 percent of the total commercial sector (Figure 33).
Through 2006, 550 buildings had gone through the Leadership in Energy and Environmental Design (LEED) rating process, developed by the U.S. Green Buildings Council. In 2006, nearly 250 buildings were rated, three times the 2004 figure. LEED differs from ENERGY STAR in its focus on green materials in addition to energy efficiency measures.
Within commercial buildings, lighting makes up a significant portion of energy consumption; therefore, energy-efficient lighting technologies have been targeted by efficiency programs. An example of an advanced, energy-saving technology that has achieved strong market acceptance is the electronic ballast. Traditionally, fluorescent lights (the dominant lighting type in commercial buildings) used magnetic ballasts, which operate lamps at the same frequency as the power line. With R&D support from the Department of Energy, higher frequency electronic ballasts were developed in the late 1970s and began to enter the market in 1985. Electronic ballasts can realize as much as a 30 percent increase in lighting energy efficiency relative to magnetic ballasts, and also enable dimming, remote control, and other energy-saving features. While sales of electronic ballasts were initially miniscule, by 2001 they had surpassed magnetic, and by 2005 constituted nearly three-quarters of the market. Electronic ballasts have saved an estimated $15 billion in commercial buildings energy use since 2005 (Figure 35).
Impacts of Policy and Regulation
By law, the Department of Energy must set energy efficiency standards for equipment and appliances at the maximum level of energy efficiency that is technically feasible and economically justified. DOE strives to establish standards that maximize consumer benefits and minimize negative impacts on manufacturers and other stakeholders.
In 2006, the Department of Energy released a schedule for setting new appliance efficiency standards, outlining how DOE will address the appliance standards rulemaking backlog and meet the statutory requirements established in the Energy Policy and Conservation Act (EPCA) as modified by the Energy Policy Act (EPAct) 2005. With the recent passage of the Energy Independence and Security Act of 2007, Congress has increased the number of rulemakings DOE must issue beyond the obligations set forth in EPAct 2005, bringing the level of appliance standards activity to unprecedented levels. The schedule for issuing new standards is shown in Figure 36.
State energy offices can also have a large impact on energy efficiency through standards, incentives, and efficiency programs. Utilities, working alone or with state energy offices, may also offer incentives for efficiency improvements. Utility-sponsored efficiency programs are often targeted at achieving peak load reductions.
State energy policies promote building efficiency through appliance standards, regulations, tax incentives, education, and renewable energy portfolios. The State of California, through the California Energy Commission and later with the addition of the California Public Utilities Commission, has prioritized energy efficiency, demand side resources, renewable energy, and finally clean conventional energy sources. As a result of energy efficiency programs, appliance standards, and building codes, California electricity use remained level while U.S. consumption rose (Figure 37).
Utilities play a role in energy efficiency through incentives, energy efficiency programs, and demand- side management programs. Utilities began demand- side management programs (DSM) to reduce the need for additional power-generating capacity. In 1993, spending reached its peak, dropping off after as a result of industry restructuring. Funding of DSM programs declined beginning in the mid-1990s when deregulation made it difficult for utilities to capture the benefits of their DSM investments. More recently, states have enacted a broad range of measures to provide incentives for utility investments in energy efficiency under both regulated and deregulated business models. DSM programs remain effective in states with regulated utilities. Other policies include public benefit funds for energy efficiency projects, energy efficiency resource standards, and non-traditional rate structures that enable utilities to reduce demand on their systems without eroding revenues.
Conclusion
The U.S. economy and environment are linked to the buildings we construct and the energy they use. Americans spend what amounts to a large percentage of GDP building, repairing, and powering the U.S. buildings stock. As the population and economy grow, so does our use of energy, which comes predominantly from fossil sources.
Increases in energy consumption are mitigated by:
- Mandatory codes and standards, which include Federal equipment standards, state building energy codes and equipment standards, and local building energy codes.
- Voluntary programs, such as ENERGY STAR appliances, homes, and buildings, as well as new “green” building programs and designations such as LEED and MASCO Environments for Living.
- Policies and incentives such as Federal and state tax credits; utility rebates and pricing structures; and government-backed research to develop energy-efficient technologies.